Cerca negli script per "inside bar"
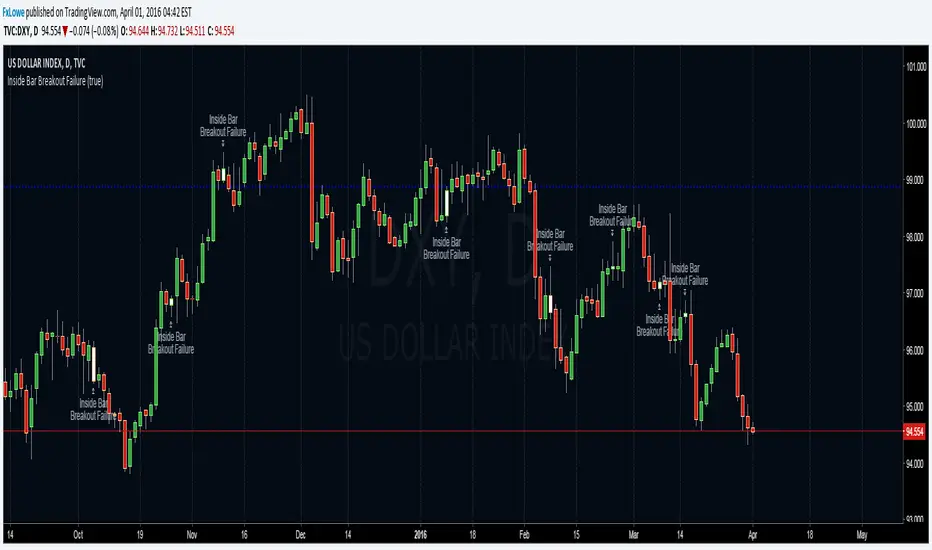
Inside Bar Breakout FailureSimple indicator to highlight Inside Bar Breakout Failure patterns on chart.

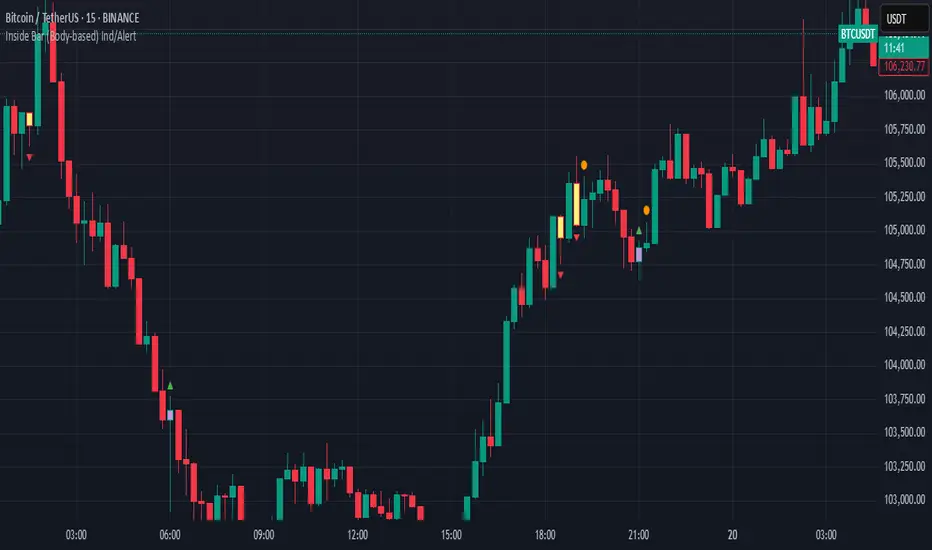
Inside Bar (Body-based) Ind/AlertDescription:
This indicator detects Inside Bar patterns based strictly on the candle body (open/close range) of the mother candle, rather than the traditional high/low wick method. An inside bar is highlighted when the current candle’s entire body is contained within the body of the previous candle.
It can be useful for traders who want a more conservative and reliable definition of inside bars, focusing on true consolidation periods and filtering out signals caused by extended wicks.
Features:
Body-based Inside Bar detection:
The indicator colors and marks candles where the current bar’s body is fully within the previous bar’s body.
Bullish/Bearish identification:
Bullish inside bars are marked in green, bearish in red.
Double Inside Bar Detection:
An optional feature marks when two consecutive candles’ bodies are inside the same mother bar body—potentially indicating stronger consolidation.
Alerts:
Set alerts for single or double inside bars for automated monitoring.
How to Use:
Add the indicator to your chart.
Look for colored bars or plotted shapes for inside bar signals based on candle bodies.
Use alerts to get notified in real time when inside bar patterns appear.
Note:
This script uses only the candle body (open and close) for inside bar calculations, which may help filter out less reliable signals found with wick-based approaches.
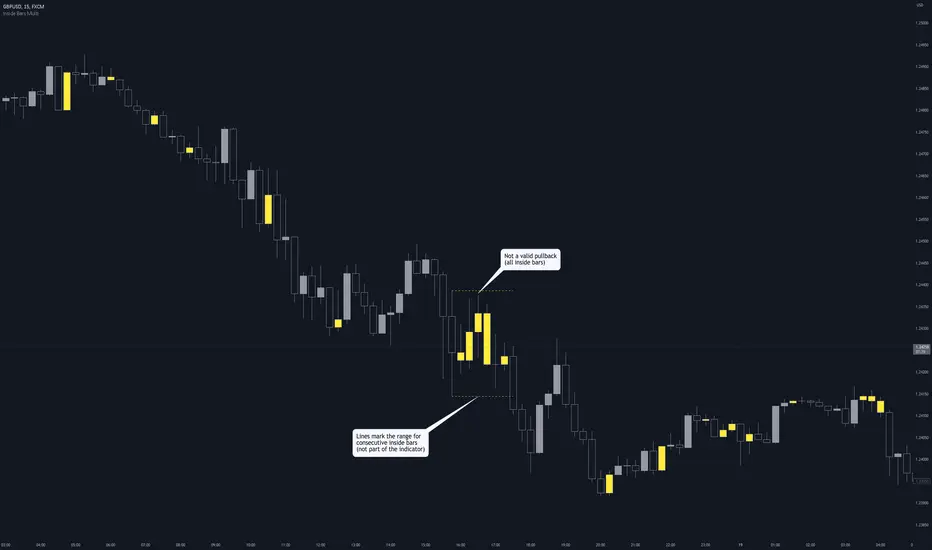
Inside Bars (Multiple / Consecutive)Description
When an inside bar is found, the indicator remembers the high and low (= range) of the candle before the inside bar.
As long as price moves within the range, every bar is highlighted as an inside bar to the range.
Purpose
The indicator can assist when identifying valid pullbacks and buy-side liquidity (BSL) / sell-side liquidity (SSL).
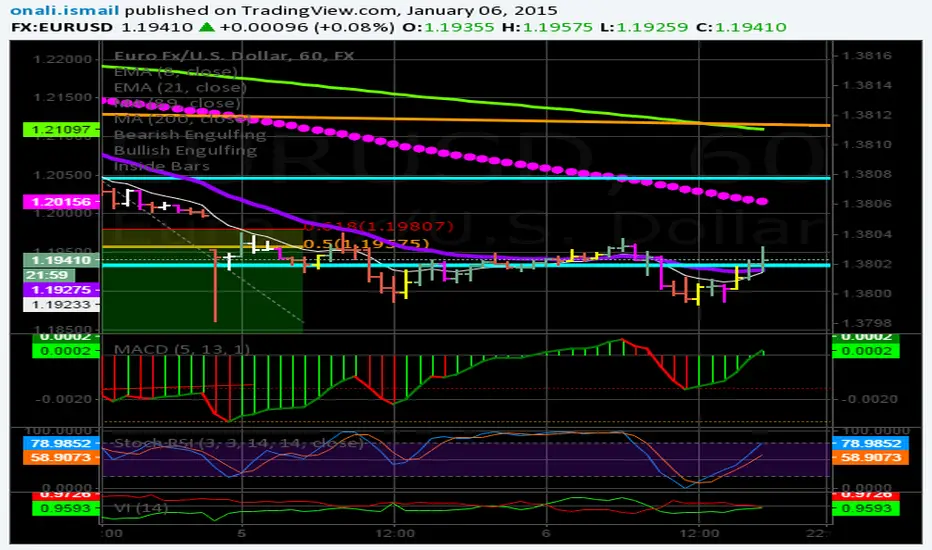
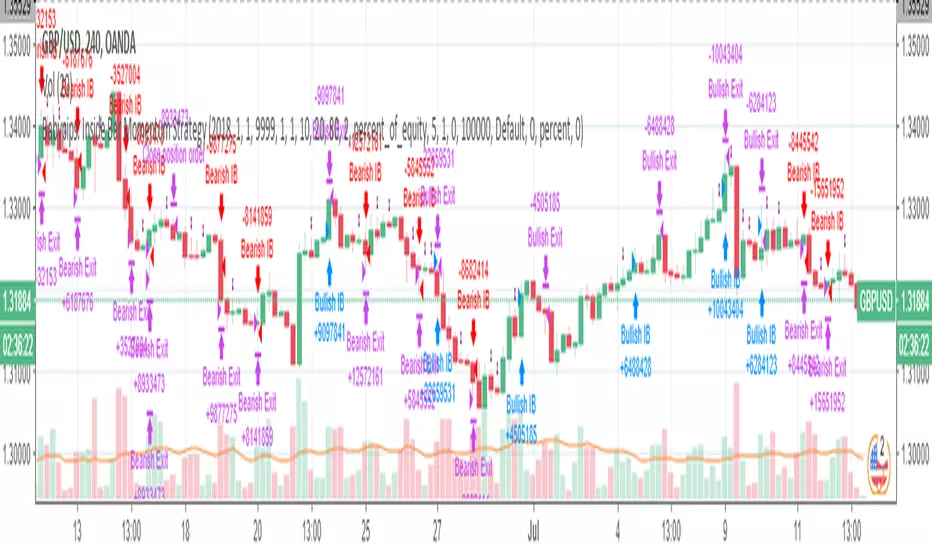
Babypips: Inside Bar Momentum StrategyThe strategy contained in this post comes courtesy of babypips (.com), an excellent resource for all thing forex related. If you are new to trading, the site is definitely worth checking out!
Code commentary and an introduction to Inside Bars are available for this post on the Backtest-Rookies (.com) website.
Note: If you are interested in custom development services, please check out our services page on the Backtest-Rookies site.
Strategy Overview
Inside Bar Momentum Strategy.
Inside Bar Detection
Position sizing based on stoploss distance ( Note: Based on equity and assumes that the account currency is the counter currency.
Stop buys for entries
Takeprofit / Stoplosses for exits
Control Stopbuy, Takeprofit and Stoploss targets with inputs
Control Backtest start/end dates
Inside BarsInside Bars Indicator
Description:
This indicator identifies and highlights price action patterns where a bar's high and low
are completely contained within the previous bar's range. Inside bars are significant
technical patterns that often signal a period of price consolidation or uncertainty,
potentially leading to a breakout in either direction.
Trading Literature & Theory:
Inside bars are well-documented in technical analysis literature:
- Steve Nison discusses them in "Japanese Candlestick Charting Techniques" as a form
of harami pattern, indicating potential trend reversals
- Thomas Bulkowski's "Encyclopedia of Chart Patterns" categorizes inside bars as
a consolidation pattern with statistical significance for breakout trading
- Alexander Elder references them in "Trading for a Living" as indicators of
decreasing volatility and potential energy build-up
- John Murphy's "Technical Analysis of the Financial Markets" includes inside bars
as part of price action analysis for market psychology understanding
The pattern is particularly significant because it represents:
1. Volatility Contraction: A narrowing of price range indicating potential energy build-up
2. Institutional Activity: Often shows large players absorbing or distributing positions
3. Decision Point: Market participants evaluating the previous bar's significance
Trading Applications:
1. Breakout Trading
- Watch for breaks above the parent bar's high (bullish signal)
- Monitor breaks below the parent bar's low (bearish signal)
- Multiple consecutive inside bars can indicate stronger breakout potential
2. Market Psychology
- Inside bars represent a period of equilibrium between buyers and sellers
- Shows market uncertainty and potential energy building up
- Often precedes significant price movements
Best Market Conditions:
- Trending markets approaching potential reversal points
- After strong momentum moves where the market needs to digest gains
- Near key support/resistance levels
- During pre-breakout consolidation phases
Complementary Indicators:
- Volume indicators to confirm breakout strength
- Trend indicators (Moving Averages, ADX) for context
- Momentum indicators (RSI, MACD) for additional confirmation
Risk Management:
- Use parent bar's range for stop loss placement
- Wait for breakout confirmation before entry
- Consider time-based exits if breakout doesn't occur
- More reliable on higher timeframes
Note: The indicator works best when combined with proper risk management
and overall market context analysis. Avoid trading every inside bar pattern
and always confirm with volume and other technical indicators.
Inside Bars ITInside Bars IT Indicator
The Inside Bars IT indicator is a powerful tool designed to identify Inside Bars and their extended patterns (InsideBar2) on any chart. An Inside Bar is a candlestick pattern where the current candle's high is lower than the previous candle's high, and the current candle's low is higher than the previous candle's low. This pattern often signals market consolidation and potential breakout opportunities.
The indicator extends the concept of Inside Bars by introducing InsideBar2, which uses the high and low of the first Inside Bar as reference levels. Subsequent candles are classified as InsideBar2 if their high is less than or equal to the reference high and their low is greater than or equal to the reference low.

Inside Bar FinderInside bars occur when the range of a candlestick falls entirely within the previous candlestick's range. This indicates volatility contraction which often leads to volatility expansion, i.e. large price movements.
This indicator includes options such as:
- The number of consecutive inside bars required to trigger the indicator
- Signal lines to indicate the high and low of the outermost or innermost bars
Try out this indicator with different options on different timeframes to see if inside bars increase the probability of identifying the direction of price movements. Breaks or closes outside the inside or outside signal lines can be used to trigger trade signals.

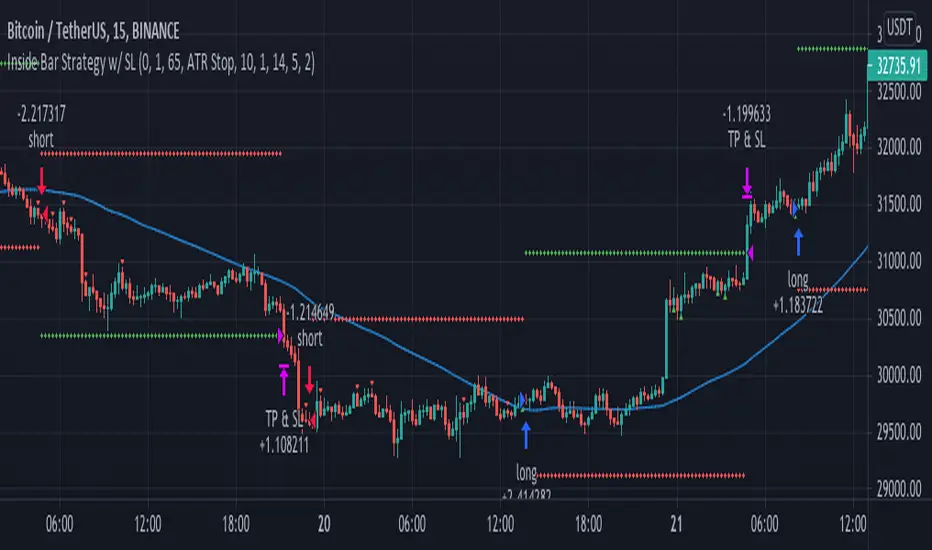
Inside Bar Strategy w/ SL"Inside bars are a two -bar pattern. They can indicate either a continuation of the
existing move or a reversal. A continuation occurs when there is no significant
support or resistance level in sight, while a reversal occurs close to a strong sup-
port or resistance level...
...A lot of traders are aware of inside bars but few manage to make money with
them. Why is this so? It goes back to interpreting price action. A lot of traders look
to trade in geometric ways. What I mean is that they search for fancy shapes on a
chart and think that this is what represents true price action.
This is not the case. A shape is just a shape. The formation by itself means
nothing unless underlying order flow backs it up. This is why it’s extremely
important that you look for inside bars when a trend is already in place.
The best place to look for them is in the beginning of trends."
Inside Bar by TarunInside bars occur when the current bar's high is lower than the previous bar's high and the current bar's low is higher than the previous bar's low. The script changes the color of inside bars to orange for better visualization.

Inside Bar HighlightInside Bar have at least 2 candles.
They include one mother candle and multiple child candles. Mother candle will cover whole child candles ( child candles have high and low within mother candle)
This script will highlight Inside Bars
How to use :
When we analyze market structure, we can combine mother candle and children candles and see them as a candle.
This script will help us do this easily.


Inside Bar Setup [as]Inside Bar Setup Indicator Description
The **Inside Bar Setup ** indicator is a powerful tool for traders to identify and visualize inside bar patterns on their charts. An inside bar pattern occurs when the current candle's high is lower than the previous candle's high, and the current candle's low is higher than the previous candle's low. This pattern can indicate a potential breakout or a continuation of the existing trend.
Key Features:
1. **Highlight Inside Bar Patterns:**
- The indicator highlights inside bar patterns with distinct colors for bullish and bearish bars. Bullish inside bars are colored with the user-defined bull bar color (default lime), and bearish inside bars are colored with the user-defined bear bar color (default maroon).
2. **Marking Mother Candle High and Low:**
- The high and low of the mother candle (the candle preceding the inside bar) are marked with horizontal lines. The high is marked with a green line, and the low is marked with a red line.
- These levels are labeled as "Range High" and "Range Low" respectively, with the labels displayed a few bars to the right for clarity. The labels have a semi-transparent background for better visibility.
3. **Target Levels:**
- The indicator calculates and plots potential target levels (T1 and T2) for both long and short positions based on user-defined multipliers of the mother candle's range.
- For long positions, T1 and T2 are plotted above the mother candle's high.
- For short positions, T1 and T2 are plotted below the mother candle's low.
- These target levels are optional and can be toggled on or off via the input settings.
4. **Customizable Inputs:**
- **Colors:**
- Bull Bar Color: Customize the color for bullish inside bars.
- Bear Bar Color: Customize the color for bearish inside bars.
- **Long Targets:**
- Show Long T1: Toggle the display of the first long target.
- Show Long T2: Toggle the display of the second long target.
- Long T1: Multiplier for the first long target above the mother candle's high.
- Long T2: Multiplier for the second long target above the mother candle's high.
- **Short Targets:**
- Show Short T1: Toggle the display of the first short target.
- Show Short T2: Toggle the display of the second short target.
- Short T1: Multiplier for the first short target below the mother candle's low.
- Short T2: Multiplier for the second short target below the mother candle's low.
5. **New Day Detection:**
- The indicator detects the start of a new day and clears the inside bar arrays, ensuring that the pattern detection is always current.
#### Usage:
- Add the indicator to your TradingView chart.
- Customize the inputs to match your trading strategy.
- Watch for highlighted inside bars to identify potential breakout opportunities.
- Use the marked range highs and lows, along with the calculated target levels, to plan your trades.
This indicator is ideal for traders looking to capitalize on inside bar patterns and their potential breakouts. It provides clear visual cues and customizable settings to enhance your trading decisions.
Note:
This indicator is based on famous 15 min inside bar strategy shared by Subashish Pani on his youtube channel Power of stocks. Please watch his videos to use this indicator for best results.

Inside Bars/Candles [CodeCraftedTrading]This Pine Script indicator is designed to identify and visually represent inside bars or candles. Here's a breakdown of its features and functionality:
1. Inputs:
insideCandlesColor: Color of the inside bars or candles.
highColor: Color of the horizontal line representing the high of the inside bar.
lowColor: Color of the horizontal line representing the low of the inside bar.
showHighLowLabel: Option to display labels for the high and low prices.
2. Logic:
The script checks for the conditions of an inside bar:
high < high and low > low
If an inside bar is detected and is not already in the range:
* Stores the high and low prices of the previous bar.
* Records the parent bar index and sets the broken flag to false.
If the current bar's high exceeds the stored high or the low falls below the stored low, the broken flag is set to true.
If the current bar is within the stored high and low range, it is considered in-range.
The script then dynamically plots horizontal lines at the high and low prices of the parent bar until the inside bar is broken.
3. Visualization:
The inside bars are colored based on the insideCandlesColor.
Horizontal lines are drawn at the high and low prices of the parent bar within the inside bar.
Optional labels display the rounded values of the high and low prices.
4. Usage:
Apply the script to your chart.
Adjust the input parameters according to your preferences.
The indicator will highlight inside bars with colored bars and draw lines representing the high and low prices. Labels are optional.
5. Note:
Inside bars are bars where the entire price range is within the high and low of the previous bar.
The script uses historical bar information and visualizes the inside bars dynamically on the chart.

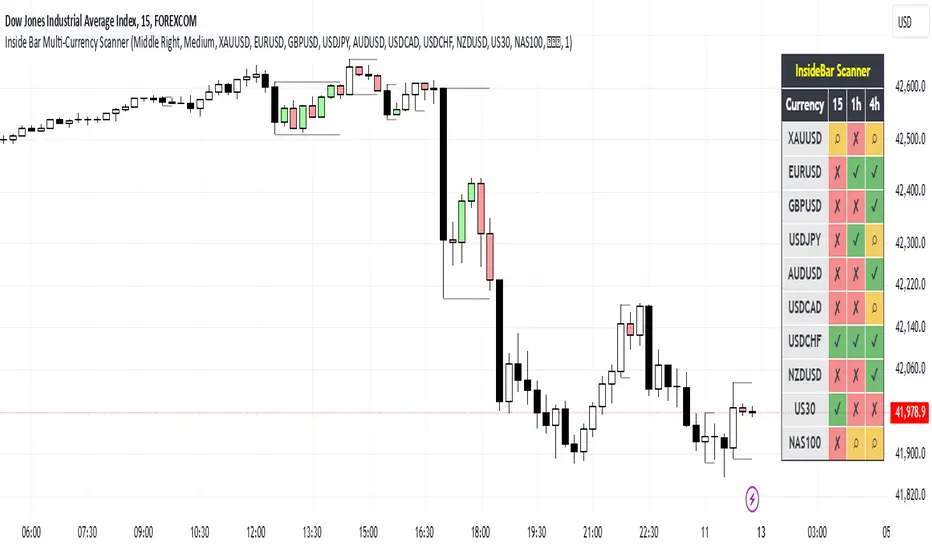
Inside Bar Multi-Currency ScannerDescription:
This script is an Inside Bar Scanner that allows you to monitor multiple currency pairs across different timeframes (15 minutes, 1 hour, and 4 hours). Its main features include:
Inside Bar Detection:
An Inside Bar is a candlestick where both the High and Low are within the range of the previous candle.
The script automatically identifies Inside Bars and displays the results in a table.
Customizable Timeframes:
Supports scanning in 15-minute, 1-hour, and 4-hour timeframes.
Results are displayed for each timeframe separately.
Multi-Currency Support:
Scan up to 10 currency pairs simultaneously.
Currency pairs are customizable and selected by the user.
Candle Coloring:
Inside Bars are highlighted with colors:
Semi-transparent green for bullish Inside Bars.
Semi-transparent red for bearish Inside Bars.
Colors are customizable and selected by the user.
Alerts:
Custom alerts for detecting Inside Bars in selected timeframes.
Receive notifications when an Inside Bar is detected in any of the selected currency pairs.
How to Use:
Select your desired currency pairs from the Scanner Currencies section.
Enable your preferred timeframes in the Scanner Timeframe section.
The script will display a table of results with Inside Bar information for each currency pair and timeframe.
Optionally, customize the candle colors in the Scanner InsideBar Color section.
Additional Explanation for Timeframe Status:
In each selected timeframe, there are three possible states for the candles:
Previous Candle is an Inside Bar:
Displayed with a green background and the symbol ✔.
Previous Candle is NOT an Inside Bar:
Displayed with a red background and the symbol ✘.
Current Candle is an Inside Bar:
Displayed with an orange background and the symbol ⌕.
These visual indicators provide a clear and quick overview of the Inside Bar status for each selected currency pair and timeframe.
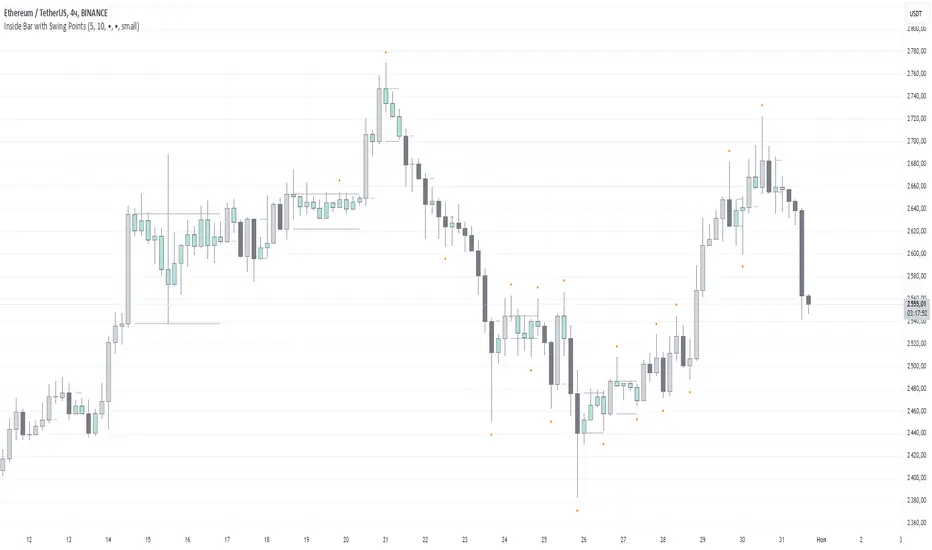
Inside Bar with Swing PointsSwing Points with Inside Bar
This script combines swing point analysis with an inside bar pattern visualization, merging essential concepts to identify and visualize key price levels and potential trend reversals. This is especially useful for traders looking to understand price action through swing levels and reactions within inside bar boundaries, making it effective for short-term trend analysis and reversal zone identification.
Script Features:
Swing Point Analysis:
The script identifies swing points based on fractals with a configurable number of bars, allowing for a choice between three and five bars, helping traders fine-tune sensitivity to price movements.
Swing points are visualized as labels, highlighting potential reversal or continuation zones in the price chart.
Inside Bar Visualization:
Inside bars are defined as bars where both the high and low are contained within the previous bar. These often signal consolidation before a potential breakout.
The script displays boundaries of the mother bar (the initial bar encompassing inside bars) and colors candles accordingly, highlighting those within these boundaries.
This feature helps traders focus on price areas where a breakout or trend shift may occur.
Utility and Application:
The script enables traders to visualize inside bars and swing points, which is particularly useful for short-term traders focused on reversal or trend continuation strategies.
Combining swing point analysis with inside bar identification offers a unique approach, helping traders locate key consolidation zones that may precede significant price moves.
This provides not only strong support and resistance levels but also insights into probable breakout points.
How to Use the Script:
Set the number of bars for swing point analysis (3 or 5) to adjust fractal sensitivity.
Enable mother bar boundary visualization and color indication for inside bars to easily spot consolidation patterns.
Pay attention to areas with multiple swing points and inside bars, as these often signal potential reversal or breakout zones.
This script offers flexible tools for analyzing price movements through both swing analysis and consolidation zone identification, aiding decision-making under uncertainty and enhancing market structure understanding.
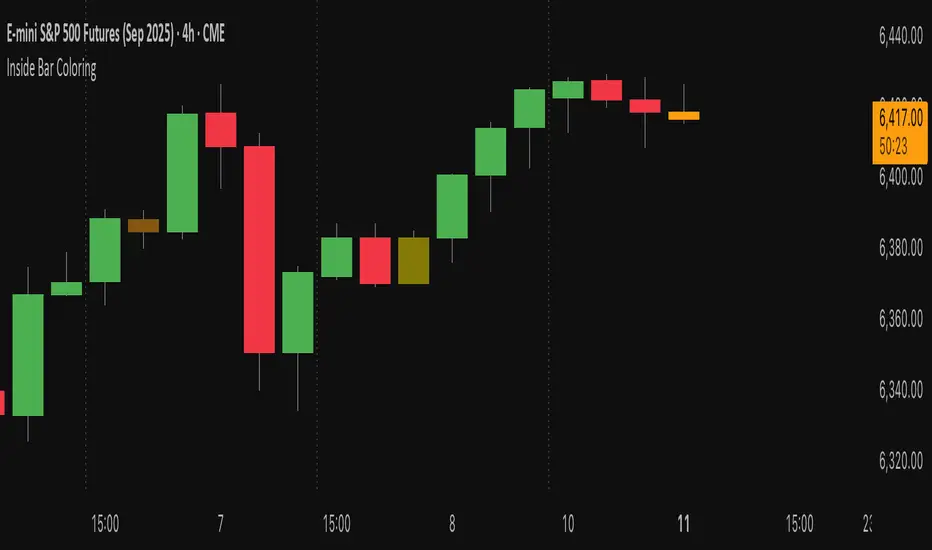
Inside Bar Coloring (Real-time + Historical) w/ AlertsDescription
This Pine Script v6 indicator identifies and colors inside bars, whose entire range (high and low) stays within the previous bar's range. It gives the option to color the real-time bar as well as historical inside bars.
Inside bars are colored differently based on whether they close above or below their opening price (bullish vs bearish). The indicator offers flexible display options including real-time-only highlighting, historical inside bar visualization with transparency, and optional triangle markers for enhanced visibility.
Utility
Inside bars represent periods of market consolidation and reduced volatility, and are by nature consolidating. During this equilibrium, it can be valuable to observe price development rather than engage with it. Conversely, a break of the equilibrium often marks a shift in volatility and provides opportunity. This indicator provides instant visual identification of this price action on your chart.
Features
Smart Coloring System: Separate colors for bullish (close ≥ open) and bearish (close < open) inside bars
Flexible Display Modes: Show only real-time bar, all historical bars, or customize transparency levels
Visual Markers: Optional triangles above or below inside bars
Real-time Alerts: Configurable alerts notify you when new inside bars form
Optimized Performance: Efficient Pine Script v6 code with minimal resource usage
Open Source: Released under Mozilla Public License 2.0
Settings
Customizable colors for bullish/bearish inside bars (real-time and historical)
Toggle historical inside bar display
Real-time bar only mode for clean charts
Adjustable marker position (above/below bars)
Alert activation with detailed price information
Inside Bar SetupScript Details
- This script plots Inside Bar for given day in selected time-frame (applicable only for Timeframes < Day)
- Basis plotted inside bar, relevant targets are marked on the chart
- Targets can be customised from script settings. Example, if range of mother candle is 10 points, then T1 is 10 * x above/below mother candle and T2 is 10 * y above/below mother candle. This x & y are configured via script settings
How to use this script ?
- This script works well on 10-15 mins timeframe for stocks, 15/30 mins timeframe for nifty index and 30/60 mins time frame for bank nifty index
- If mother candle high is broken, take long trade with SL of mother candle low and if low is broken, take short trade with SL of mother candle high
Remember:
1. Above logic is to be combined with support/resistances i.e. price action. This script is an add-on to price action analysis giving you more conviction.
2. If range of mother candle is very high, it is recommended to avoid the trade.
3. Basis inside bar formed on higher time frame, take trade on basis of lower time frame i.e if inside bar is formed on 60 mins, take trade on the basis of 10-15 mins time frame
Example:
1. As seen in the chart, Nifty is near it's resistance and we are seeing Inside Bar being formed, In such scenario, even if High of Mother Candle is broken, we should be more interested to short as we are near resistance and probability of getting our targets in long side is less.
2. So, if I see breakdown of mother candle i.e. price going below low of mother candle, we will short with SL of high of mother candle.
3. As seen in the chart, both the targets are achieved.
Additional Info:
1. Targets on Long/Short Side can be configured via settings. For indices 1 times/1.5 times the range works well.
2. This script plots targets basis the first inside bar formed in the day for selected time frame.
3. Inside bars formed through out the day are coloured separately but lines are plotted only on the basis of 1st formed inside bar as this strategy works well for the first formed inside bar)
4. Don't forget to check volume in case of breakout/breakdown.
Note:
1. Mother Candle - First Candle of Inside Bar
2. Child Candle - Candle formed inside Mother Candle (Second Candle of Inside Bar)
Happy Trading :)

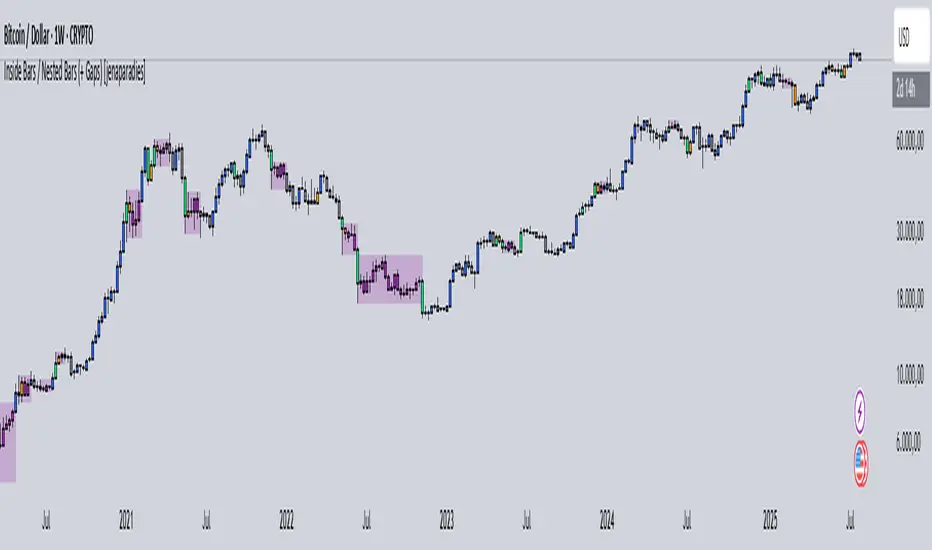
Inside Bars / Nested Bars (+ Gaps) [jenaparadies]📌 Features
Highlight inside bars
Highlight bars that remain within the range of a mother bar (called nested bars )
Highlight the mother bar (optional)
Highlight consecutive nested bars using a visual box (optional)
Enable no-gap candle logic (optional, see below)
Show no-gap candles on the chart (optional)
Fully customizable colors and appearance
📌 Method
An inside bar is any candle whose high is lower than or equal to the previous candle's high, and whose low is higher than or equal to the previous candle's low. In other words, the entire price action of the inside bar remains within the range of the previous candle without exceeding it. The preceding candle is referred to as the mother bar .
Occasionally, the candle following the inside bar may break above or below the inside bar's range, while still remaining fully within the high and low of the mother bar. These candles are referred to as nested bars and are highlighted in a different color.
Optionally, sequences of consecutive nested bars can be enclosed within a box to emphasize consolidation zones.
📌 No-Gap Candles (Optional)
This feature adjusts each candle’s opening price so that it matches the closing price of the previous candle. It is particularly useful for assets that frequently experience large gaps between candles.
By extending each candle's effective range to include the previous candle's close, the indicator maintains structural consistency over timeframes, especially when the open price deviates significantly from the prior close. Inside bars are then identified relative to the extended range of the mother bar.
Optionally, the adjusted no-gap candles can be visualized directly on the chart for better clarity.
🎁 Bonus
Activating the "Show No-Gap Candles" option transforms any line chart into a gap-free bar chart ‒ ideal for visualizing economic data such as inflation rates.
Inside Bar Detector - 15min
🔍 What is an Inside Bar?
An **Inside Bar** is a candle that forms **entirely within the high and low of the previous candle**. It represents **consolidation**, **indecision**, or **potential reversal**, and is a key signal in The Strat trading method.
🔧 What the Script Does:
1. **Timeframe Restriction**:
* The script activates **only on the 15-minute timeframe**, avoiding clutter on other timeframes.
2. **Inside Bar Logic**:
* It checks whether the **current bar’s high is lower than the previous bar’s high**, **AND** the **current bar’s low is higher than the previous bar’s low**.
* If both conditions are true, it confirms an Inside Bar.
3. **Visual Display**:
* When an Inside Bar is detected, the script **plots a yellow label ("1") above the bar**.
* The label represents the Strat 1-bar and helps you easily spot potential setups.
🎯 Use Case:
* Ideal for **Strat traders**, **price action analysts**, or **any trader** looking for breakout or reversal opportunities.
* Common setups include **1-2**, **1-3**, or **double inside bar** breakouts.

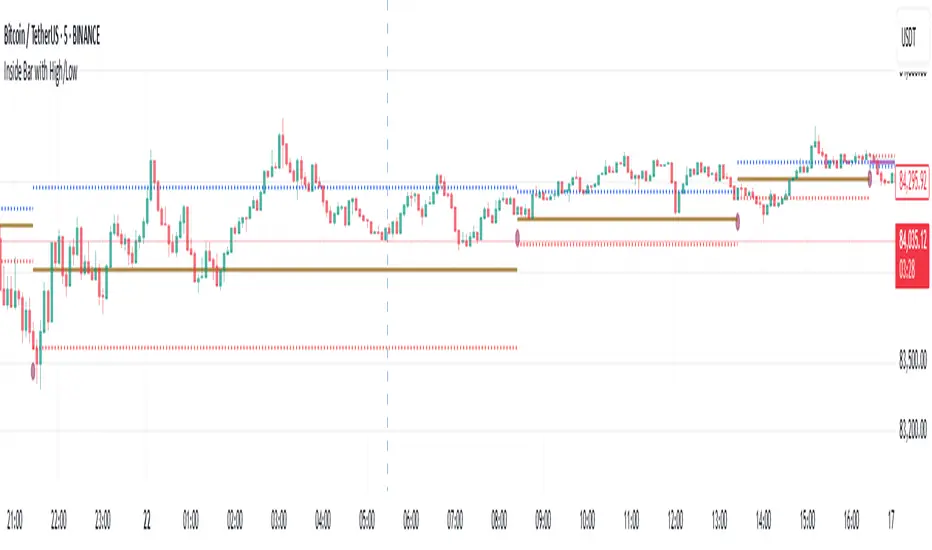
Inside Bar with High/LowInside Bar with High/Low
The indicator plots horizontal mid line between two Inside bars with High / Low with Multi Time Frame Selection by the user which can be traded in trending markets in the direction of the trend, when traded this way they are typically referred to as a ‘Breakout Play’ or an inside bar ‘Price Action Breakout Pattern’ They can also be traded counter-trend, typically from ‘Key Chart Levels’ , when traded this way they are often referred to as ‘Inside Bar Reversals’ .
The classic entry for an inside bar signal is to place a buy stop or sell stop at the high or low of the mother bar, and then when price breakouts above or below the mother bar, your entry order is filled with best time frame preferably more than 1 hour.
Stop loss placement is typically at the opposite end of the mother bar, or it can be placed near the mother bar halfway point (50% level), typically if the mother bar is larger than average.
It’s worth noting that these are the ‘classic’ or standard entry and stop loss placements for an inside bar setup is a useful tool for traders looking to identify potential reversals using the 20/50 EMA and candlestick patterns. However, like any trading tool, it should be used in conjunction with other indicators and analysis techniques for better accuracy
And also this tool is especially useful for day traders who want to track price action during specific times of the day and make informed decisions based on market behavior with more than 60 minutes period
As always, back testing and customization are recommended to optimize performance across different market conditions
In the end, experienced traders may decide on other entries or stop loss placements as they see fit.
Please remember that this indicator is provided for educational purposes only and does not constitute financial advice